Aphantasia Percentage and How Many People Have It
If you have just learned that some people can picture a friend's face, a beach, or a red apple in their mind, the next question is often simple: how many people are like me? The short answer is that the most cited aphantasia percentage is about 3.9% of people when researchers include absent, dim, or vague voluntary visual imagery. A stricter estimate for people who report no voluntary visual image at all is closer to 0.8% to 1%. Those numbers are best treated as estimates, not personal labels. If you want a calm way to compare your own imagery experience with common research-style questions, a gentle aphantasia self-reflection tool can be a useful starting point.
The Most Useful Aphantasia Percentage
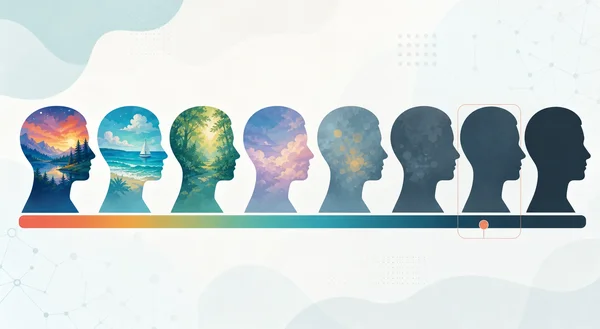
For everyday search intent, the clearest answer is this: around 4% of people may fall into the low or absent visual imagery range often discussed as aphantasia. This comes from prevalence work using the Vividness of Visual Imagery Questionnaire, usually shortened to VVIQ, which asks people to rate how vividly they can voluntarily form mental pictures across several scenes.
That 4% figure is often rounded from a combined estimate of 3.9%. In the same research context, the most extreme group, people who choose the lowest possible imagery rating across all VVIQ items, is much smaller, around 0.8%. In plain English, the answer changes depending on whether you mean "no picture at all" or "little to no useful visual picture."
This distinction matters because people use the word aphantasia in different ways. Some use it narrowly for complete absence of voluntary visual imagery. Others use it broadly for the very low end of the visual imagery spectrum. Both uses appear in public discussion, which is why you may see percentages ranging from about 1% to about 4%, or broader informal estimates around 2% to 5%.
Why Aphantasia Prevalence Percentages Vary
Aphantasia is measured through first-person reports, and inner experience is hard to verify from the outside. Two people may both say "I can imagine an apple," while one sees a vivid inner image and the other only knows the concept, shape, or facts about an apple. That makes wording, scale choice, and cutoff points important.
Three issues explain most percentage differences:
- Some studies count only the strictest "no image" group.
- Some studies include people with very dim or vague visual imagery.
- Online communities can overrepresent people who already suspect they have unusual imagery.
The VVIQ is helpful because it gives a structured way to ask about vividness, but it is still a self-report tool. It does not turn a private experience into a perfect laboratory measurement. A good aphantasia percentage should therefore be read as a population estimate based on defined criteria, not a universal rule for every person, culture, age group, or testing setting.
What Percentage of the Population Has Aphantasia
If someone asks, "What percentage of the population has aphantasia?" the safest direct answer is: about 1% for the strictest no-image definition, and about 4% for broader low or absent visual imagery. The broader estimate is the one people usually mean when they say "around one in twenty-five people."
Here is a simple way to think about it:
| Definition Used | Approximate Percentage | Practical Meaning |
|---|---|---|
| Strict absent visual imagery | 0.8% to 1% | No voluntary mental picture, even faintly |
| Low or absent imagery range | 3.9% to 4% | No image, or images so dim/vague they feel minimally useful |
| Informal public estimates | 2% to 5% | Rounded ranges used in explainers and community discussions |
The number may change as researchers improve sampling, compare countries, and refine terms such as aphantasia, hypophantasia, typical imagery, and hyperphantasia. For an informational article, the important point is not to force one number into every context. It is better to explain the range and what each estimate includes.
Is Aphantasia Rare or Common
Aphantasia is uncommon, but it is not vanishingly rare. If the broader estimate is close to 4%, many classrooms, workplaces, and large families may include at least one person with very low visual imagery. At the same time, most people are somewhere in the middle of the imagery spectrum, and people at the extreme low end are a minority.
This is one reason many people discover aphantasia late. They may assume phrases like "picture it in your mind" are metaphors. Visualizers may assume everyone sees some kind of inner image. Both assumptions can quietly hide how different people's inner lives are.
The percentage also helps soften the experience. Learning that your mind works differently can feel surprising, but the numbers show that low visual imagery is part of normal human variation. It can affect how someone remembers, plans, reads, or creates, yet it does not decide intelligence, creativity, or worth.
How Aphantasia Percentage Relates to Autism and ADHD
Searches about aphantasia percentage often overlap with autism and ADHD questions. The careful answer is that researchers are still mapping these relationships. Some studies report links between aphantasia and autistic traits, and a recent autism-focused imagery study found a higher share of aphantasia-range scores among autistic adults than among non-autistic adults in that sample.
That does not mean aphantasia is a form of autism. It also does not mean that most people with aphantasia are autistic, or that a person can infer neurodevelopmental status from visual imagery alone. The direction of the question matters: "What percentage of autistic people meet an aphantasia cutoff?" is not the same as "What percentage of people with aphantasia are autistic?"
The same caution applies to ADHD. People may notice overlapping experiences such as attention differences, memory workarounds, or unusual thinking styles, but overlap is not the same as a simple cause. If you are exploring aphantasia alongside autism, ADHD, anxiety, memory concerns, or learning differences, it is better to treat imagery as one piece of a larger cognitive profile.
How to Estimate Your Own Place on the Imagery Scale
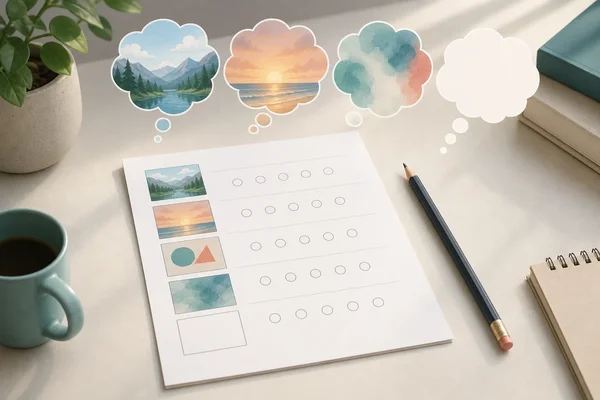
Percentages are useful, but your own experience still needs careful wording. A VVIQ-style approach asks you to imagine several scenes, such as a familiar person or a landscape, and rate vividness rather than relying on one dramatic apple example. This helps separate "I know what the thing is" from "I visually experience the thing in my mind."
When you use a VVIQ-style aphantasia test, keep the result in proportion. It can help you organize your self-description, notice patterns, and find language for your mind's eye experience. It should not be treated as a medical verdict or a full cognitive evaluation.
Try these reflection questions:
- Do you experience any voluntary visual image, even faintly?
- Is your imagery stable, or does it appear as quick flashes?
- Do you rely more on words, facts, spatial sense, emotion, or bodily memory?
- Do dreams feel visual even if waking imagery is blank?
- Does your experience change when you are tired, stressed, or emotionally engaged?
These questions can make the percentage feel more personally meaningful. Someone with no stable visual images may relate to the strict low end. Someone with dim, partial, or inconsistent images may still fall near the broader low-imagery range, depending on the scale and cutoff used.

What the Percentage Does Not Tell You
The aphantasia percentage does not tell you whether someone is creative, intelligent, emotionally deep, or good at reading. People with aphantasia may enjoy novels, solve design problems, make art, write vividly, remember facts well, or build strong spatial strategies. Some may find visual memory tasks difficult; others may barely notice an impact until the topic comes up in conversation.
Research reviews suggest that aphantasia can be associated with differences in autobiographical memory, face recognition, sensory imagery, and emotional response to imagined scenes. But association is not destiny. A population percentage describes how often a trait appears; it does not describe the full person.
It also does not explain every cause. Aphantasia may be lifelong for many people, while some cases are acquired after neurological or psychological events. Family patterns have been reported, but "is aphantasia genetic?" remains more complex than a single inheritance rule. The better framing is that visual imagery appears to vary across a spectrum shaped by brain networks, development, self-report, and lived experience.
How to Use Aphantasia Percentage Without Overreading It
The best use of an aphantasia percentage is orientation. It tells you that your experience may be less common, but still shared by many people. It gives you language for reading research, comparing community stories, and deciding whether a structured self-reflection exercise would help.
If you are trying to understand your own result, consider three layers:
- The population layer: roughly how many people report similar imagery vividness.
- The personal layer: how imagery affects your memory, reading, planning, and creativity.
- The support layer: whether you need study strategies, communication language, or professional guidance for broader concerns.
AphantasiaTest.com is built around that middle ground: educational, gentle, and focused on insight rather than alarm. You can use the mind's eye self-exploration platform to reflect on your imagery style, then bring your own observations into learning, work, creativity, or a professional conversation if broader cognitive questions are affecting daily life.
FAQ
What is the most accepted aphantasia percentage?
The most commonly cited research-based estimate is about 3.9%, often rounded to 4%, when aphantasia includes absent, dim, or vague voluntary visual imagery. A stricter "no voluntary image at all" estimate is closer to 0.8% to 1%.
How rare is aphantasia?
Aphantasia is uncommon but not extremely rare. A broad estimate of about 4% means roughly one in twenty-five people may fall into the low or absent visual imagery range, depending on the definition and measurement used.
Is aphantasia linked to high IQ?
There is no solid reason to treat aphantasia as a sign of high IQ. People with aphantasia can have many different abilities, education levels, creative styles, and problem-solving strengths. Visual imagery is one cognitive dimension, not a full measure of intelligence.
Is aphantasia a form of autism?
No. Aphantasia is not the same thing as autism. Some research has found overlap between low visual imagery and autistic traits, but that does not make one trait equivalent to the other. Many people with aphantasia are not autistic, and many autistic people have vivid imagery.
Do people with aphantasia enjoy reading?
Yes, many do. Some readers enjoy plot, ideas, emotion, language, structure, or character logic without seeing scenes visually. Others may prefer nonfiction, dialogue-heavy fiction, audiobooks, or books with maps and reference images. Reading enjoyment does not require a vivid mind's eye.
Can aphantasia percentages from Reddit be trusted?
Reddit can be useful for lived-experience language, but it is not a representative sample of the population. Communities naturally attract people who already suspect they have the trait, so they can make aphantasia seem more common than structured population studies suggest.
Why do some sources say 1% and others say 4%?
They are usually using different definitions. Around 1% refers to the strictest group with no voluntary visual image, while around 4% includes people with absent, very dim, or vague imagery. Checking the cutoff behind the number is more helpful than arguing over one universal percentage.